Release 8.1.5
A67775-01
Library |
Product |
Contents |
Index |
| Oracle8i Tuning Release 8.1.5 A67775-01 |
|
This chapter describes how to solve CPU resource problems. Topics in this chapter include:
To address CPU problems, first establish appropriate expectations for the amount of CPU resources your system should be using. Then distinguish whether sufficient CPU resources are available and recognize when your system is consuming too many resources. Begin by determining the amount of CPU resources the Oracle instance utilizes in three cases, when your system is:
Workload is an important factor when evaluating your system's level of CPU utilization. During peak workload hours, 90% CPU utilization with 10% idle and waiting time may be acceptable; 30% utilization at a time of low workload may also be understandable. However, if your system shows high utilization at normal workload, there is no room for a peak workload. For example, Figure 18-1 illustrates workload over time for an application having peak periods at 10:00 AM and 2:00 PM.
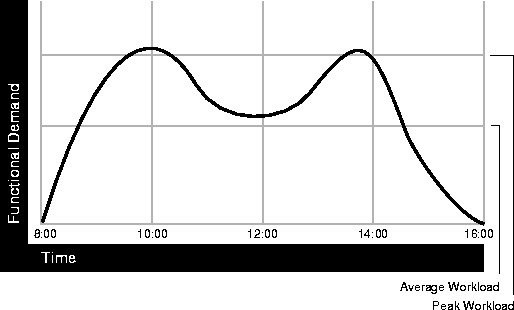
This example application has 100 users working 8 hours a day, for a total of 800 hours per day. Each user entering one transaction every 5 minutes translates into 9,600 transactions daily. Over an 8-hour period, the system must support 1,200 transactions per hour, which is an average of 20 transactions per minute. If the demand rate were constant, you could build a system to meet this average workload.
However, usage patterns are not constant--and in this context, 20 transactions per minute can be understood as merely a minimum requirement. If the peak rate you need to achieve is 120 transactions per minute, you must configure a system that can support this peak workload.
For this example, assume that at peak workload Oracle can use 90% of the CPU resource. For a period of average workload, then, Oracle use no more than about 15% of the available CPU resource as illustrated in the following equation:
20 tpm/120 tpm * 90% = 15%
Where tpm is "transactions per minute".
If the system requires 50% of the CPU resource to achieve 20 tpm, then a problem exists: the system cannot achieve 120 transactions per minute using 90% of the CPU. However, if you tuned this system so it achieves 20 tpm using only 15% of the CPU, then, assuming linear scalability, the system might achieve 120 transactions per minute using 90% of the CPU resources.
As users are added to an application, the workload can rise to what had previously been peak levels. No further CPU capacity is then available for the new peak rate, which is actually higher than the previous.
If you suspect a problem with CPU usage, check two areas:
Oracle statistics report CPU use by only Oracle sessions, whereas every process running on your system affects the available CPU resources. Effort spent tuning non-Oracle factors can thus result in improved Oracle performance.
Use operating system monitoring tools to determine what processes are running on the system as a whole. If the system is too heavily loaded, check the memory, I/O, and process management areas described later in this section.
Tools such as sar -u on many UNIX-based systems enable you to examine the level of CPU utilization on your entire system. CPU utilization in UNIX is described in statistics that show user time, system time, idle time, and time waiting for I/O. A CPU problem exists if idle time and time waiting for I/O are both close to zero (less than 5%) at a normal or low workload.
On NT, use Performance Monitor to examine CPU utilization. Performance Manager provides statistics on processor time, user time, privileged time, interrupt time, and DPC time. (NT Performance Monitor is not the same as Performance Manager, which is an Oracle Enterprise Manager tool.)
Check the following memory management areas:
Paging and Swapping Use tools such as sar or vmstat on UNIX or Performance Monitor on NT to investigate the cause of paging and swapping.
Oversize Page Tables On UNIX, if the processing space becomes too large, it may result in the page tables becoming too large. This is not an issue on NT.
Check the following I/O management issues:
Thrashing Ensure your workload fits into memory so the machine is not thrashing (swapping and paging processes in and out of memory). The operating system allocates fixed portions of time during which CPU resources are available to your process. If the process wastes a large portion of each time period in checking to be sure that it can run and to ensure all needed components are in the machine, the process may be using only 50% of the time allotted to actually perform work.
Client/Server Round Trips The latency of sending a message may result in CPU overload. An application often generates messages that need to be sent through the network over and over again, resulting in significant overhead before the message is actually sent. To alleviate this problem, batch the messages and perform the overhead only once or reduce the amount of work. For example, you can use array inserts, array fetches, and so on.
Check the following process management issues:
Scheduling and Switching The operating system may spend excessive time scheduling and switching processes. Examine the way in which you are using the operating system because you could be using too many processes. On NT systems, do not overload your server with too many non-Oracle processes.
Context Switching Due to operating system specific characteristics, your system could be spending a lot of time in context switches. Context switching could be expensive, especially with a large SGA. Context switching is not an issue on NT which has only one process per instance; all threads share the same page table.
Programmers often create single-purpose processes, exit the process, and create a new one. Doing this re-creates and destroys the process each time. Such logic uses excessive amounts of CPU, especially with applications that have large SGAs. This is because you have to build the page tables each time. The problem is aggravated when you pin or lock shared memory, because you have to access every page.
For example, if you have a 1-gigabyte SGA, you may have page table entries for every 4K, and a page table entry may be 8 bytes. You could end up with
(1G /4K) * 8B entries. This becomes expensive, because you have to continually make sure that the page table is loaded.
Parallel execution and multi-threaded server are areas of concern if MINSERVICE has been set too low (set to 10, for example, when you need 20). For an application that is performing small lookups, this may not be wise. In this situation, it becomes inefficient for the application and for the system as well.
This section explains how to examine the processes running in Oracle. Two dynamic performance views provide information on Oracle processes:
For example, if you have 8 CPUs, then for any given minute in real time, you have 8 minutes of CPU time available. On NT and UNIX, this can be either user time or time in system mode ("privileged" mode, in NT). If your process is not running, it is waiting. CPU time utilized by all systems may thus be greater than one minute per interval.
At any given moment you know how much time Oracle has used on the system. So if 8 minutes are available and Oracle uses 4 minutes of that time, then you know that 50% of all CPU time is used by Oracle. If your process is not consuming that time, then some other process is. You then need to identify the processes that are using CPU time. If you can, determine why the processes are using so much CPU time attempt to tune them.
The major areas to check for Oracle CPU utilization are:
This section describes each area and indicates the corresponding Oracle statistics to check.
When Oracle executes a SQL statement, it parses it to determine whether the syntax and its contents are correct. This process can consume significant overhead. Once parsed, Oracle does not parse the statement again unless the parsing information is aged from the memory cache and no longer available.
Ineffective memory sharing among SQL statements can result in reparsing. Use the following procedure to determine whether reparsing is occurring:
SELECT * FROM V$SYSSTAT
WHERE NAME IN
('parse time cpu', 'parse time elapsed', 'parse count (hard)');
Where:
|
Response time |
Service time + wait time, therefore response time = elapsed time. |
|
Service time |
CPU time, therefore elapsed time - CPU time = wait time. |
In this way, you can detect the general response time on parsing. The more your application is parsing, the more contention exists and the more time your system spends waiting. Note the following:
|
Wait time/parse count |
Average wait time per parse. |
SELECT SQL_TEXT, PARSE_CALLS, EXECUTIONS FROM V$SQLAREA
ORDER BY PARSE_CALLS;
Tune the statements with the higher numbers of parse calls.
Inefficient SQL statements can consume large amounts of CPU resources. To detect such statements, enter the following query. You may be able to reduce CPU usage by tuning SQL statements that have a high number of buffer gets.
SELECT BUFFER_GETS, EXECUTIONS, SQL_TEXT FROM V$SQLAREA;
Your system may spend excessive time rolling back changes to blocks in order to maintain a consistent view. Consider the following scenarios:
A solution is to make more rollback segments, or to increase the commit rate. For example, if you batch ten transactions and commit them once, you reduce the number of transactions by a factor of ten.
You can also increase the size of the buffer cache to enable the database writer process(es) to keep up. To find the average number of buffers the system scans at the end of the least recently used list (LRU) to find a free buffer, use the following formula:

On average, you would expect to see 1 or 2 buffers scanned. If more than this number are being scanned, increase the size of the buffer cache or tune the DBWn process(es).
Use the following formula to find the number of buffers that were dirty at the end of the LRU:

If many dirty buffers exist, it could mean that the DBWn process(es) cannot keep up. Again, increase the buffer cache size or tune the DBWn process.
In most of this CPU tuning discussion, we assume you can achieve linear scalability, but this is never actually the case. How flat or nonlinear the scalability is indicates how far away from optimal performance your system is. Problems in your application might be adversely affecting scalability. Examples of this include too many indexes, right-hand index problems, too much data in the blocks, or not properly partitioning the data. These types of contention problems waste CPU cycles and prevent the application from attaining linear scalability.
Latch contention is a symptom of CPU problems; it is not normally a cause. To resolve it, you must locate the latch contention within your application, identify its cause, and determine which part of your application is poorly written.
In some cases, the spin count may be set too high. It's also possible that one process may be holding a latch that another process is attempting to secure. The process attempting to secure the latch may be endlessly spinning. After a while, this process may go to sleep and later resume processing and repeat its ineffectual spinning. To resolve this:
If there is a lot of contention, it may be better for a process to go to sleep at once when it cannot obtain a latch, rather than use CPU time by spinning.
If you have maximized the CPU power on your system and have exhausted all means of tuning your system's CPU use, consider redesigning your system on another architecture. Moving to a different architecture might improve CPU use. This section describes architectures you might consider using, such as:
Consider whether changing from several clients with one server, all running on a single machine (single tier), to a two-tier client/server configuration would relieve CPU problems.
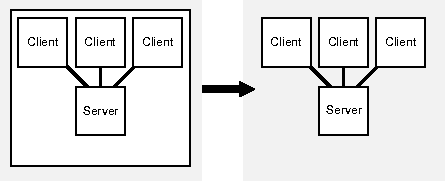
Consider whether using smaller clients improves CPU usage rather than using multiple clients on larger machines. This strategy may be helpful with either two-tier or three-tier configurations.

If your system runs with multiple layers, consider whether moving from a two-tier to three-tier configuration and introducing a transaction processing monitor might be a good solution.
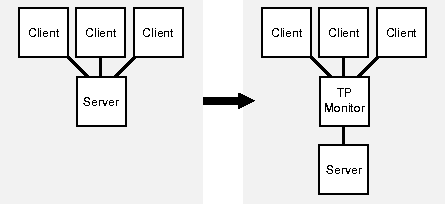
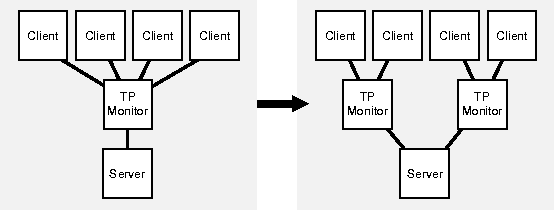
Consider using multiple transaction processing monitors.
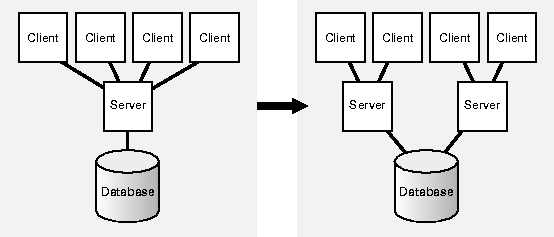
Consider whether incorporating Oracle Parallel Server would solve your CPU problems.
