Release 1.4.0
A53696_01
Library |
Product |
Contents |
Index |
| Oracle Enterprise Manager Oracle Trace User's Guide Release 1.4.0 A53696_01 |
|
Oracle Trace collects data for products that are instrumented with the Oracle Trace data collection API. Use the Oracle Trace Manager application to create and administer Oracle Trace collections for instrumented products.
To date, Oracle Corporation has instrumented two products with the Oracle Trace data collection API: Oracle Server release 7.3 and higher and SQL*Net release 2.3 and higher.
As you add additional instrumented products to nodes that are managed through Oracle Enterprise Manager, you can use the Oracle Trace Manager to automatically discover these products and make them available for collection administration.
This chapter includes the following:
You start Oracle Trace from the Oracle Enterprise Manager (OEM) console using either the:
The process of starting an application in OEM is referred to as launching.
Because Oracle Trace uses the Oracle Enterprise Manager job subsystem to perform its tasks, the Oracle Enterprise Manager console must be running at the same time as Oracle Trace.
| Note:
For further information on the Oracle Enterprise Manager, refer to the Oracle Enterprise Manager documentation set. |
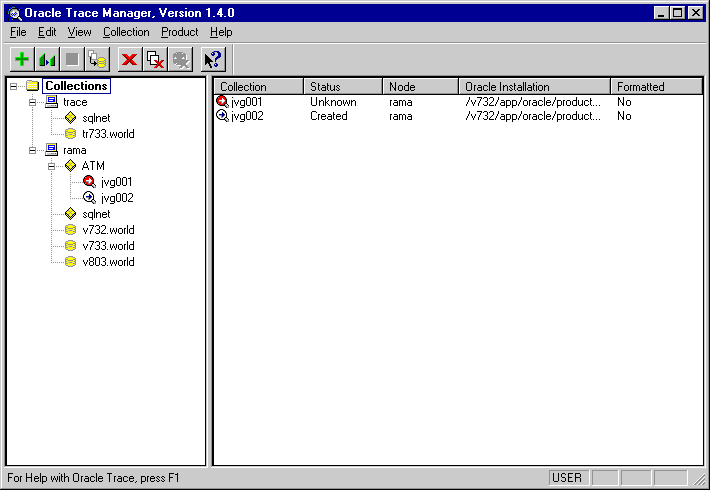
When you launch Oracle Trace, the Oracle Trace Manager main window displays, as shown in Figure 2-1.

The window consists of menus, panes, a toolbar, and a status bar. Use the menus and the toolbar to access Oracle Trace functionality. The status bar provides information relating to the task you are performing.
The left pane of the Oracle Trace main window provides a tree structure representing the hierarchy of the Oracle Trace objects. The top-most object in the tree structure is the Collections container. Expanding this container displays all the nodes that have been discovered by Oracle Trace. Expanding each node displays a list of products and databases that are instrumented. Each product or database may contain one or more collections that have been executed, or are currently executing. Click on the plus sign (+) to expand the tree and the minus sign (-) to collapse the tree.
The right pane of the window displays information relevant to the object highlighted in the left pane. In general, this information provides details about active and completed Oracle Trace collections for a selected object in the tree. The information is based on data stored in Oracle Trace tables within the Oracle Enterprise Manager repository.
| Note:
The repository is a set of tables stored in an Oracle database. For a more detailed description of the repository, refer to the Oracle Enterprise Manager Concepts Guide. |
Some or all of the following information is provided in the right pane of the Oracle Trace main window, depending on what is highlighted in the left pane:
The collection name.
The current status of the collection: active, inactive, or stopped.
The name of the node on which the collection was run.
The location of the set of products from which data is being collected.
The format status of the collection data. The status is listed as Yes if all the data has been formatted. If the status is listed as No, then the data has not been formatted.
The Oracle Trace toolbar icons represent the items in the menus. The toolbar options (see Figure 2-2) are enabled depending on the objects selected in the tree list.

The Oracle Trace icons are as follows:
 Creates a collection. Click this icon to create a collection.
 Creates a similar collection. Select a collection in the tree list, then click this icon to create a similar collection. This is the same as choosing the Collection=>Create Like... option.
 Stops a collection. Select a collection in the tree list and click this icon to stop collecting event data.
 Formats a collection. Select a collection in the tree list and click this icon to format a collection.
 Deletes a collection. Select a collection in the tree list and click this icon to delete the existing collection.
 Deletes the collection definition file (.cdf) and data collection file (.dat) for the selected collection.
 Deletes formatted data. Select a collection with formatted data and click this icon to delete formatted data from the database.
 Invokes Windows help mode. When in help mode, you can click the pulldown entry to see the object's context-sensitive help without invoking its command.
The following sections briefly describe the menus in the Oracle Trace Manager. The menus are:
The File menu contains the following option:
Exits the Oracle Trace application.
Collections that are currently running will continue to run until they are stopped, the maximum file size is reached (if one was specified when the collection was started), or the scheduled end time is reached.
The Edit menu contains the following options:
Removes highlighted text and places it in a buffer for the Paste operation. You use this option in the Collection Wizard.
Makes a copy of highlighted text to be pasted in another location. You use this option in the Collection Wizard.
Places copied or cut text at the position of the cursor. You use this option in the Collection Wizard.
Displays the Preferences dialog box in which you identify default format options used by the Collection Wizard.
The View menu contains the following options:
Forces Oracle Trace to update and validate against Oracle Enterprise Manager node and database information.
Enables or disables display of the toolbar in the Oracle Trace Manager main window. A check next to the Toolbar option indicates that the toolbar is enabled.
Enables or disables display of the Status bar in the Oracle Trace Manager main window. The Status bar displays status messages as actions are performed. A check next to the Status Bar option indicates that status messages are enabled.
The Collection menu contains the following options:
Starts the Collection Wizard. Use this wizard to enter the information Oracle Trace needs to create a collection.
Starts the Collection Wizard if a collection is highlighted in the left pane of the Oracle Trace main window. The information from the highlighted collection is copied to the new collection. You can either accept or change this information.
Stops an active collection selected in the tree list.
Formats the collection data to a database.
Deletes a collection. Select a collection in the tree list and click this icon to delete the existing collection.
Deletes formatted data. Select a collection with formatted data and click this icon to delete formatted data from the database.
Deletes the collection definition file (.cdf) and the data collection file (.dat) for the selected collection.
The Product menu contains the following options:
Starts a process that identifies whether Oracle Trace is installed on a node, and if so, identifies what, if any, instrumented products are on that node.
| Note:
Oracle Trace Manager uses the list of nodes known to the Oracle Enterprise Manager console. |
Creates a new product definition file.
Edits an existing product definition file.
The Help menu contains the following options:
Provides a list of Oracle Trace help topics.
Displays a dialog box containing a scrollable list of index entries and keywords that you can search for in the help system.
Displays information on using the Microsoft Windows help system.
Displays a dialog box containing version and copyright information about Oracle Trace Manager.
The Oracle Trace Manager provides the user with a graphical navigator display of products and database services that are enabled for Oracle Trace data collection. These products and services reside on nodes that are managed by the Oracle Enterprise Manager console. Products and services enabled with Oracle Trace calls are located or discovered by the Oracle Trace Manager during the product discovery process.
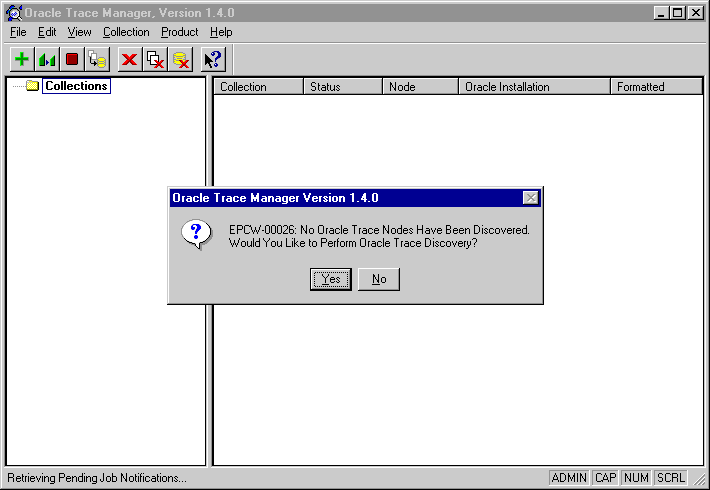
When you invoke Oracle Trace for the first time, the tree list in the left pane of the Oracle Trace main window is empty; there are no entries under Collections. A message displays asking whether you want to perform an Oracle Trace discovery (see Figure 2-3).

The Oracle Trace discovery process gathers information on products and services enabled with Oracle Trace calls by submitting batch jobs to specific nodes through the Oracle Enterprise Manager job system and Oracle Intelligent Agent. These jobs query the managed nodes for instrumented product information and return the results to the Oracle Trace Manager, which updates the repository and the Oracle Trace Manager graphical display. The user can only submit Oracle Trace collections for products and services that have been successfully discovered.
If the user has created Oracle Trace collections on a node that fails Oracle Trace discovery, or if specific products or services fail discovery, the Oracle Trace navigator displays these collections and all associated products and services as disabled (grayed out).
To populate the tree list with products that are instrumented with Oracle Trace, you must tell Oracle Trace to discover these products.
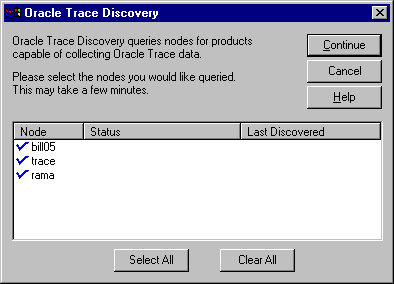
To discover products for the first time, click on the Yes button. At any other time, invoke Product=>Discovery. The Oracle Trace Discovery dialog box displays, as shown in Figure 2-4.

The Oracle Trace Discovery dialog box contains the following fields and buttons:
Select the nodes on which you want to perform the discovery. Only nodes that have Oracle Enterprise Manager agents running on them are displayed in the dialog box. For each selected node, the discovery process identifies whether Oracle Trace is installed on the node and what products are available for data collection. For products to be available for data collection, they must be instrumented with Oracle Trace calls.
This field shows the status of the last discovery process that took place on the node.
This field lists when the last discovery took place for this node.
When you click the Continue button, Oracle Trace begins the discovery process. The Product Discovery Status dialog box displays. This dialog box provides a visual cue to the progress of the discovery and the results of the process.
Click the Cancel button to stop the discovery process.
Click the Help button to get help on the discovery process.
If you encounter a problem while using the Oracle Trace Manager, do the following:
For example, enter "epc.exe /l" for the windows Run command. This displays the Oracle Trace Log window, which displays in-depth information about Oracle Trace Manager client/server processing.
The messages from the server are prefixed with EPC and are found in the EPC_ERROR.LOG file. The messages from the client are prefixed with EPCW. The EPC_ERROR.LOG file provides information about the collection processing.
For general information about causes and actions for most Oracle Trace messages, see the Oracle Enterprise Manager Messages Manual.
| Note:
Specific to Oracle Server collections. In Oracle8 databases, the ORACLE_TRACE_ENABLE parameter in the INITsid.ORA file on the server must be set to TRUE before the database is started. |